assets
4,874,762
(87,076)
(2,968,875)
1,818,811
assets
2,439,242
(165,837)
(1,942,023)
331,382
assets
2,650,163
6,000,000
50,687,125
assets
3,822,101
5,940,000
44,557,986
assets
2,316,219
5,880,000
48,100,749
18,485,439
15,142,845
89,293,511
16,341,647
14,005,330
75,421,084
assets
757,957
73,569,032
624,232,172
672,332,921
assets
(1,392,236)
59,133,857
535,133,801
585,820,926
assets
(1,060,854)
61,837,466
563,647,302
608,205,288
Summarized Statement of Financial Position
Summarized Statement of Changes in Operating Surplus (Deficit)
as
at
years
ended
june
30
assets
[note 6]
Total current assets
Investments, at market
Capital assets, net
Conservation lands and agreements
[note 3]
revenue
Donations of conservation lands and agreements
Other donations and grants
Proceeds from property sales
Other
liabilities
and
net
assets
Current
Accounts payable and accrued liabilities
Operating loan
Current portion of long-term debt
[note 6]
Deferred contributions
Total current liabilities
Long-term debt
[note 6]
Deferred revenue related to sales of carbon offset credits
Total liabilities
Net assets
Internally restricted
Invested in conservation lands and agreements
Other
Operating surplus (deficit)
Science and Stewardship Endowments
Total net assets
expenses
Conservation lands and agreements acquired
Purchased
Donated
Loan repayments for prior year acquisitions
Contributions to properties acquired and property-related
expenses incurred by others
Property related
Support
Excess of revenue over expenses for the year
Net transfer to internally restricted net assets
Net transfer to internally endowed net assets
Net change in operating surplus (deficit)
Operating deficit, beginning of year
Operating surplus (deficit), end of year
assets
41,849,778
77,663,007
3,501,292
549,318,844
672,332,921
assets
11,728,803
74,202,866
600,000
7,636,604
94,168,273
assets
3,800,406
___
3,178,254
32,925,870
39,904,530
assets
34,642,119
11,728,803
1,155,751
8,138,554
55,665,227
assets
(1,060,854)
757,957
assets
546,964,803
2,940,380
549,905,183
assets
40,174,952
63,209,991
4,156,784
478,279,199
585,820,926
assets
6,249,565
1,500,000
3,245,096
31,042,301
42,036,962
assets
475,772,688
1,619,492
477,392,180
assets
35,090,260
65,677,697
3,813,079
503,624,252
608,205,288
assets
3,374,771
69,474,669
13,476
4,997,410
77,860,326
assets
2,021,618
___
3,121,634
29,652,633
34,795,885
assets
23,855,813
3,374,771
293,106
17,550,417
45,074,107
(1,392,236)
(1,060,854)
assets
500,189,460
2,681,230
502,870,690
june
30, 2013
2013
july
1, 2011
june
30, 2012
2012
$
$
$
$
$
See accompanying notes
See accompanying notes
58
59
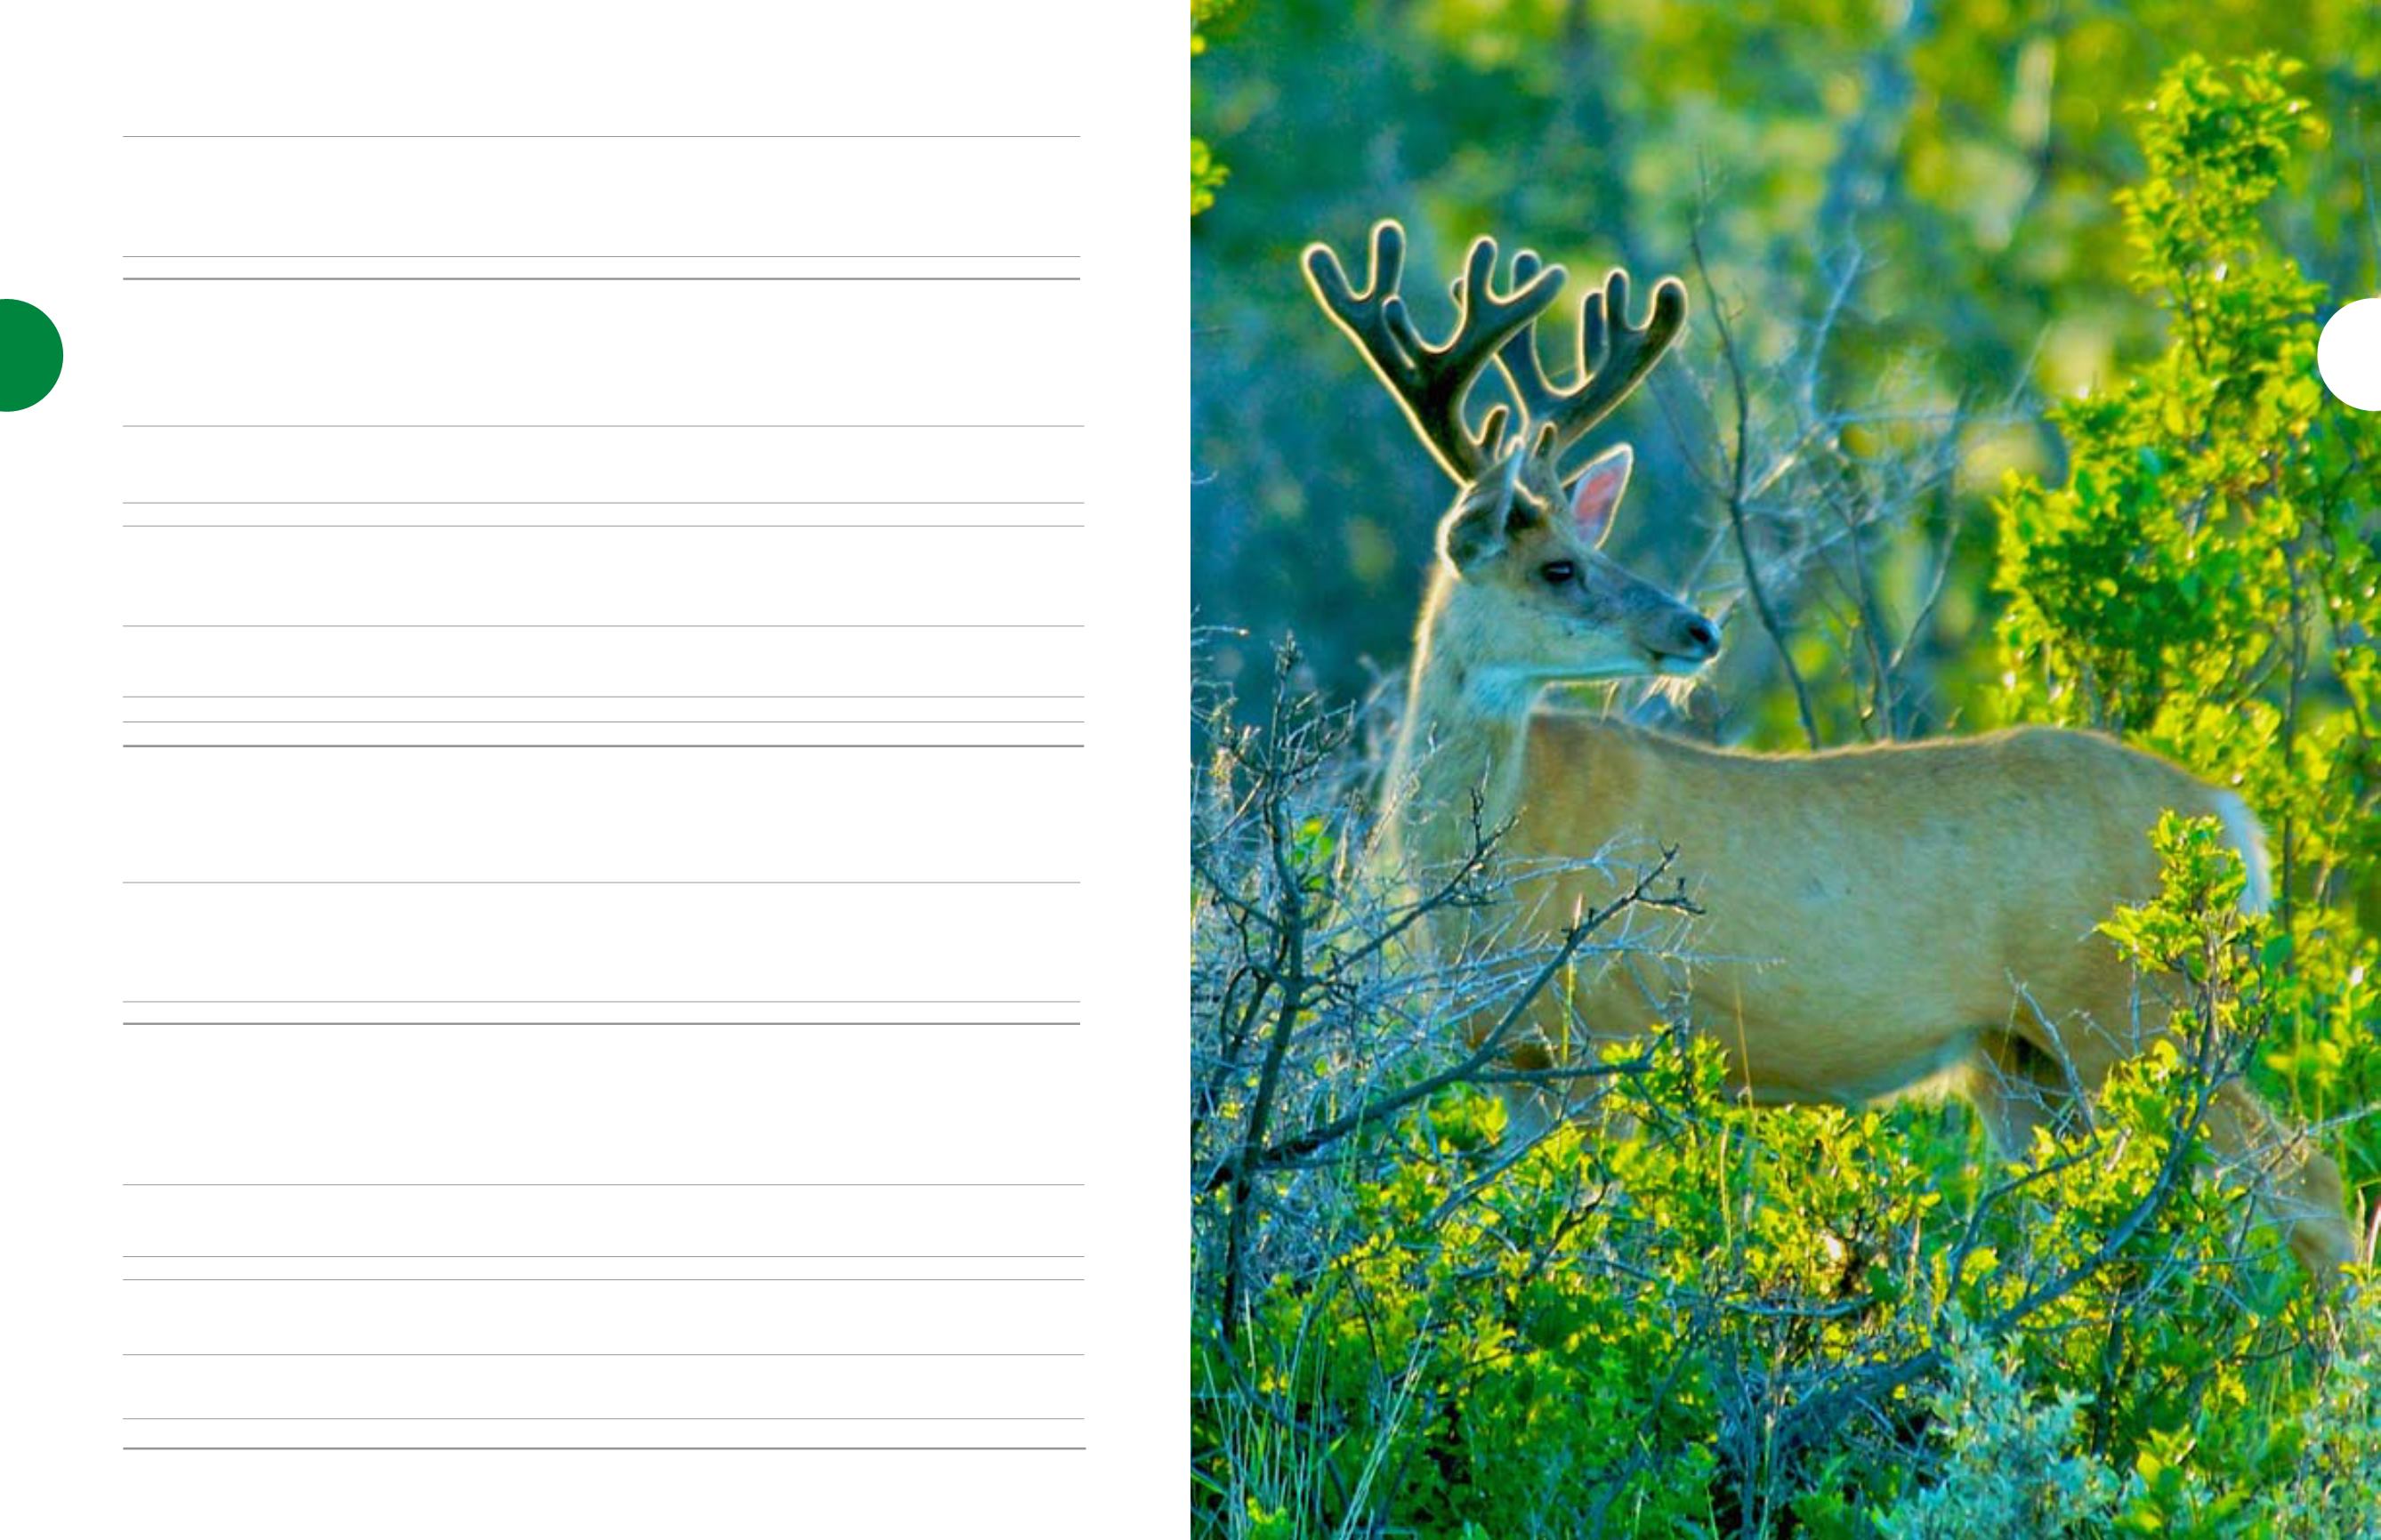
MULE deer, ab
Photo by Karol Dabbs


